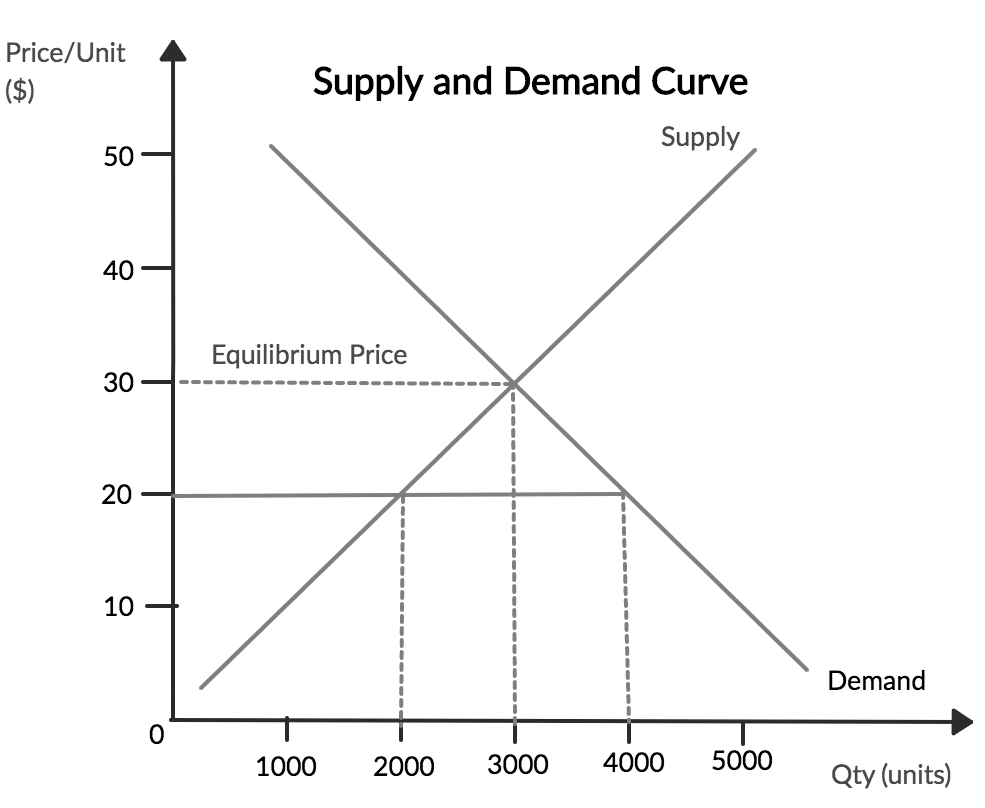
 The next essential kind of chart seen throughout microeconomics is the supply and demand graph. This standard graph is used to show the quantity demanded and supplied at a given price. For example, a consumer might only buy one phone if they cost $100 each, but if those phones cost $1 each, then they would buy 100. This line lies along the X-axis and an easy way to remember this is demand to the land as its a decreasing line. On the Y-axis lies the supply line, which is the complete opposite of the demand line. Following the same phone example, the producer is willing to sell 100 phones if the consumer will buy them at $100, but they are also only willing to sell one at $1. To remember that the Y-axis is supply a helpful line is supply to the sky. These two forces always are at odds as greed drives their wants and this means that both will argue and fight to get the best price, but eventually will meet in the middle where the consumers and the producers meet a point at which both are willing to sell and buy the product at the same quantity and price. This is the basic structure which any product in economics is based on and is very important in understanding microeconomics. -Sammy Epstein 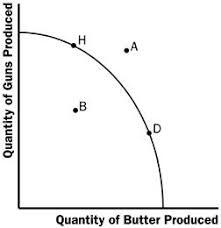 One of the oldest graphs dealing with microeconomics is the guns and butter chart. This chart shows the relationship between two products and their ability to produce them. Take, for example, guns and butter from which the chart gets its name. The more guns you make means you can't make as much butter and vice versa. This is the law of scarcity as there are only so many resources able to go around so you can only produce one. To determine which is the best option, you must look at the opportunity cost. The opportunity cost is the price of the next best option; for example, you reading this right now represents an opportunity cost analysis. Your next best option could be endlessly scrolling through youtube watching cat videos, but instead, you chose to read this as you saw this option had more value than the other. The resource which is scarce in that scenario is your time as you only have enough to do one. This type of analysis is used by economists to determine significant decisions for companies such as will they make more profit selling 500 new phones and 100 tablets or will 500 tablets and 100 phones are the better option. You calculate the cost of the next best option to determine if it is the right choice to make. The Guns and Butter chart is just a visual representation of this idea where you have two products or activities on either axis. The graph represents the split of the products you can produce and to calculate that, for example, using the numbers above the opportunity cost of making the 500 phones would be 400 tablets because that is now what you are losing by making that decision.
-Sammy Epstein There is only one logical beginning to learning about economics, and that is, what is economics? Contrary to popular belief, it’s not seeing whether the stock market is going to climb or dive or the science of getting rich. Lionel Robbins best describes it as “Economics is the science which studies human behavior as a relationship between given ends and scarce means which have alternative uses.” Economics is broken down into two portions, Micro and Macro. Micro deals with the economics of a single product such as a Phone and how competition or prices will affect sales. This idea is governed by the yin and yang or supply and demand. The supply side will always strive to sell the most amount of products at the highest possible price, and the demand side will try to pull on the reigns while getting the most products, but at the lowest price. Together these two work to find the middle ground known as the equilibrium. I will touch more on this at a later date, but for now, I am sticking with the basics. The simple definition of Macro is that it involves all products and the entire economy of the United States. For example, a Macroeconomist might question whether to fear that an increase in the currency will cause inflation or help the poverty rate. These are grand questions that Macro answers. These two forms of economics can be seen as two branches of the same tree, but both are vastly different and very important to how the world functions.
-Sammy Epstein |
